

Producing PDFs programmatically is painful. With the advent of LLMs, generating content is easier than ever - but layout has become more difficult! When the output from a model can vary in size and shape, adapting the document becomes even more important. An agent like Claude can write your report, but turning that into production-grade PDFs means wrestling with HTML-PDF tools or arcane reporting libraries.
I’m going to show you how connecting Claude Code to Papermill’s MCP server makes it easy to design a template that you can then use to reliably generate high-quality production documents. You can achieve similar results with other models.
As an example, we’re going to use Claude+Papermill to generate a PDF briefing of every asteroid that narrowly missed Earth in the last week, taking data from a NASA API.
Use Opus, not Fable
Despite Fable being marketed as a more “visual” model, we’ve found that Opus is just as good - if not better - at producing templates. So please switch /model to the latest version of Opus.
Also, we recommend you set the effort level to "high", that is the default effort level. If you use higher settings, you may find that Claude skips ahead a step sometimes.
Be Prepared to Make Tea
Models like Anthropic’s Fable and Opus, particularly on the higher effort thinking levels, can take their sweet time when generating templates. That’s fine - we can often switch to other tasks whilst it works. But sometimes you’ll want to grab a cup of tea (we’re British, after all) instead of waiting five minutes. We’re always working on speeding up model-Papermill interaction, and expect to see wait times drop as models improve.
Pipeline
We’re going to get the data from the NASA NeoWs API. We’ll use their demo API key as our usage volume will be light.
You can learn more about the API at
https://data.nasa.gov/dataset/asteroids-neows-api
Setup
Install Claude Code if you haven’t already: https://code.claude.com/docs/en/quickstart
Sign up for a free Papermill account: https://papermill.io/
Grab an API key: https://app.papermill.io/settings and set the environment variable PAPERMILL_API_KEY
Add Papermill’s MCP to Claude:
Verify the install:
Decide on a Payload
Let’s ask Claude to shape a clean JSON payload from the raw NASA data:
Claude came back with this pretty tidy-looking JSON:
{
  "report": {
    "title": "Near-Earth Object Weekly Briefing",
    "period": { "start_date": "2026-06-29", "end_date": "2026-07-05" },
    "generated_at": "2026-07-06T00:00:00Z",
    "source": "NASA/JPL NeoWs Feed"
  },

  "kpis": {
    "objects_tracked": 32,
    "potentially_hazardous_count": 5,
    "closest_approach": {
      "name": "523808 (2007 ML24)",
      "date": "2026-07-04",
      "miss_distance_km": 3476895,
      "miss_distance_lunar": 9.04
    },
    "largest_object": {
      "name": "(2015 KJ157)",
      "est_diameter_max_m": 863,
      "is_potentially_hazardous": false
    },
    "fastest_object": {
      "name": "…",
      "velocity_kps": 36.08
    }
  },

  "objects": [
    {
      "name": "523808 (2007 ML24)",
      "approach_date": "2026-07-04",
      "est_diameter_min_m": 120.4,
      "est_diameter_max_m": 269.2,
      "velocity_kps": 12.34,
      "miss_distance_km": 3476895,
      "miss_distance_lunar": 9.04,
      "is_potentially_hazardous": false
    }
  ],

  "commentary": "Free-text analyst summary of the week's activity - trends, notable approaches, and context for the hazardous flags."
}
Initial Template
Let’s ask Claude to generate a first draft of a template:
Once Claude is done, you’ll receive a link to the template in the Papermill editor:
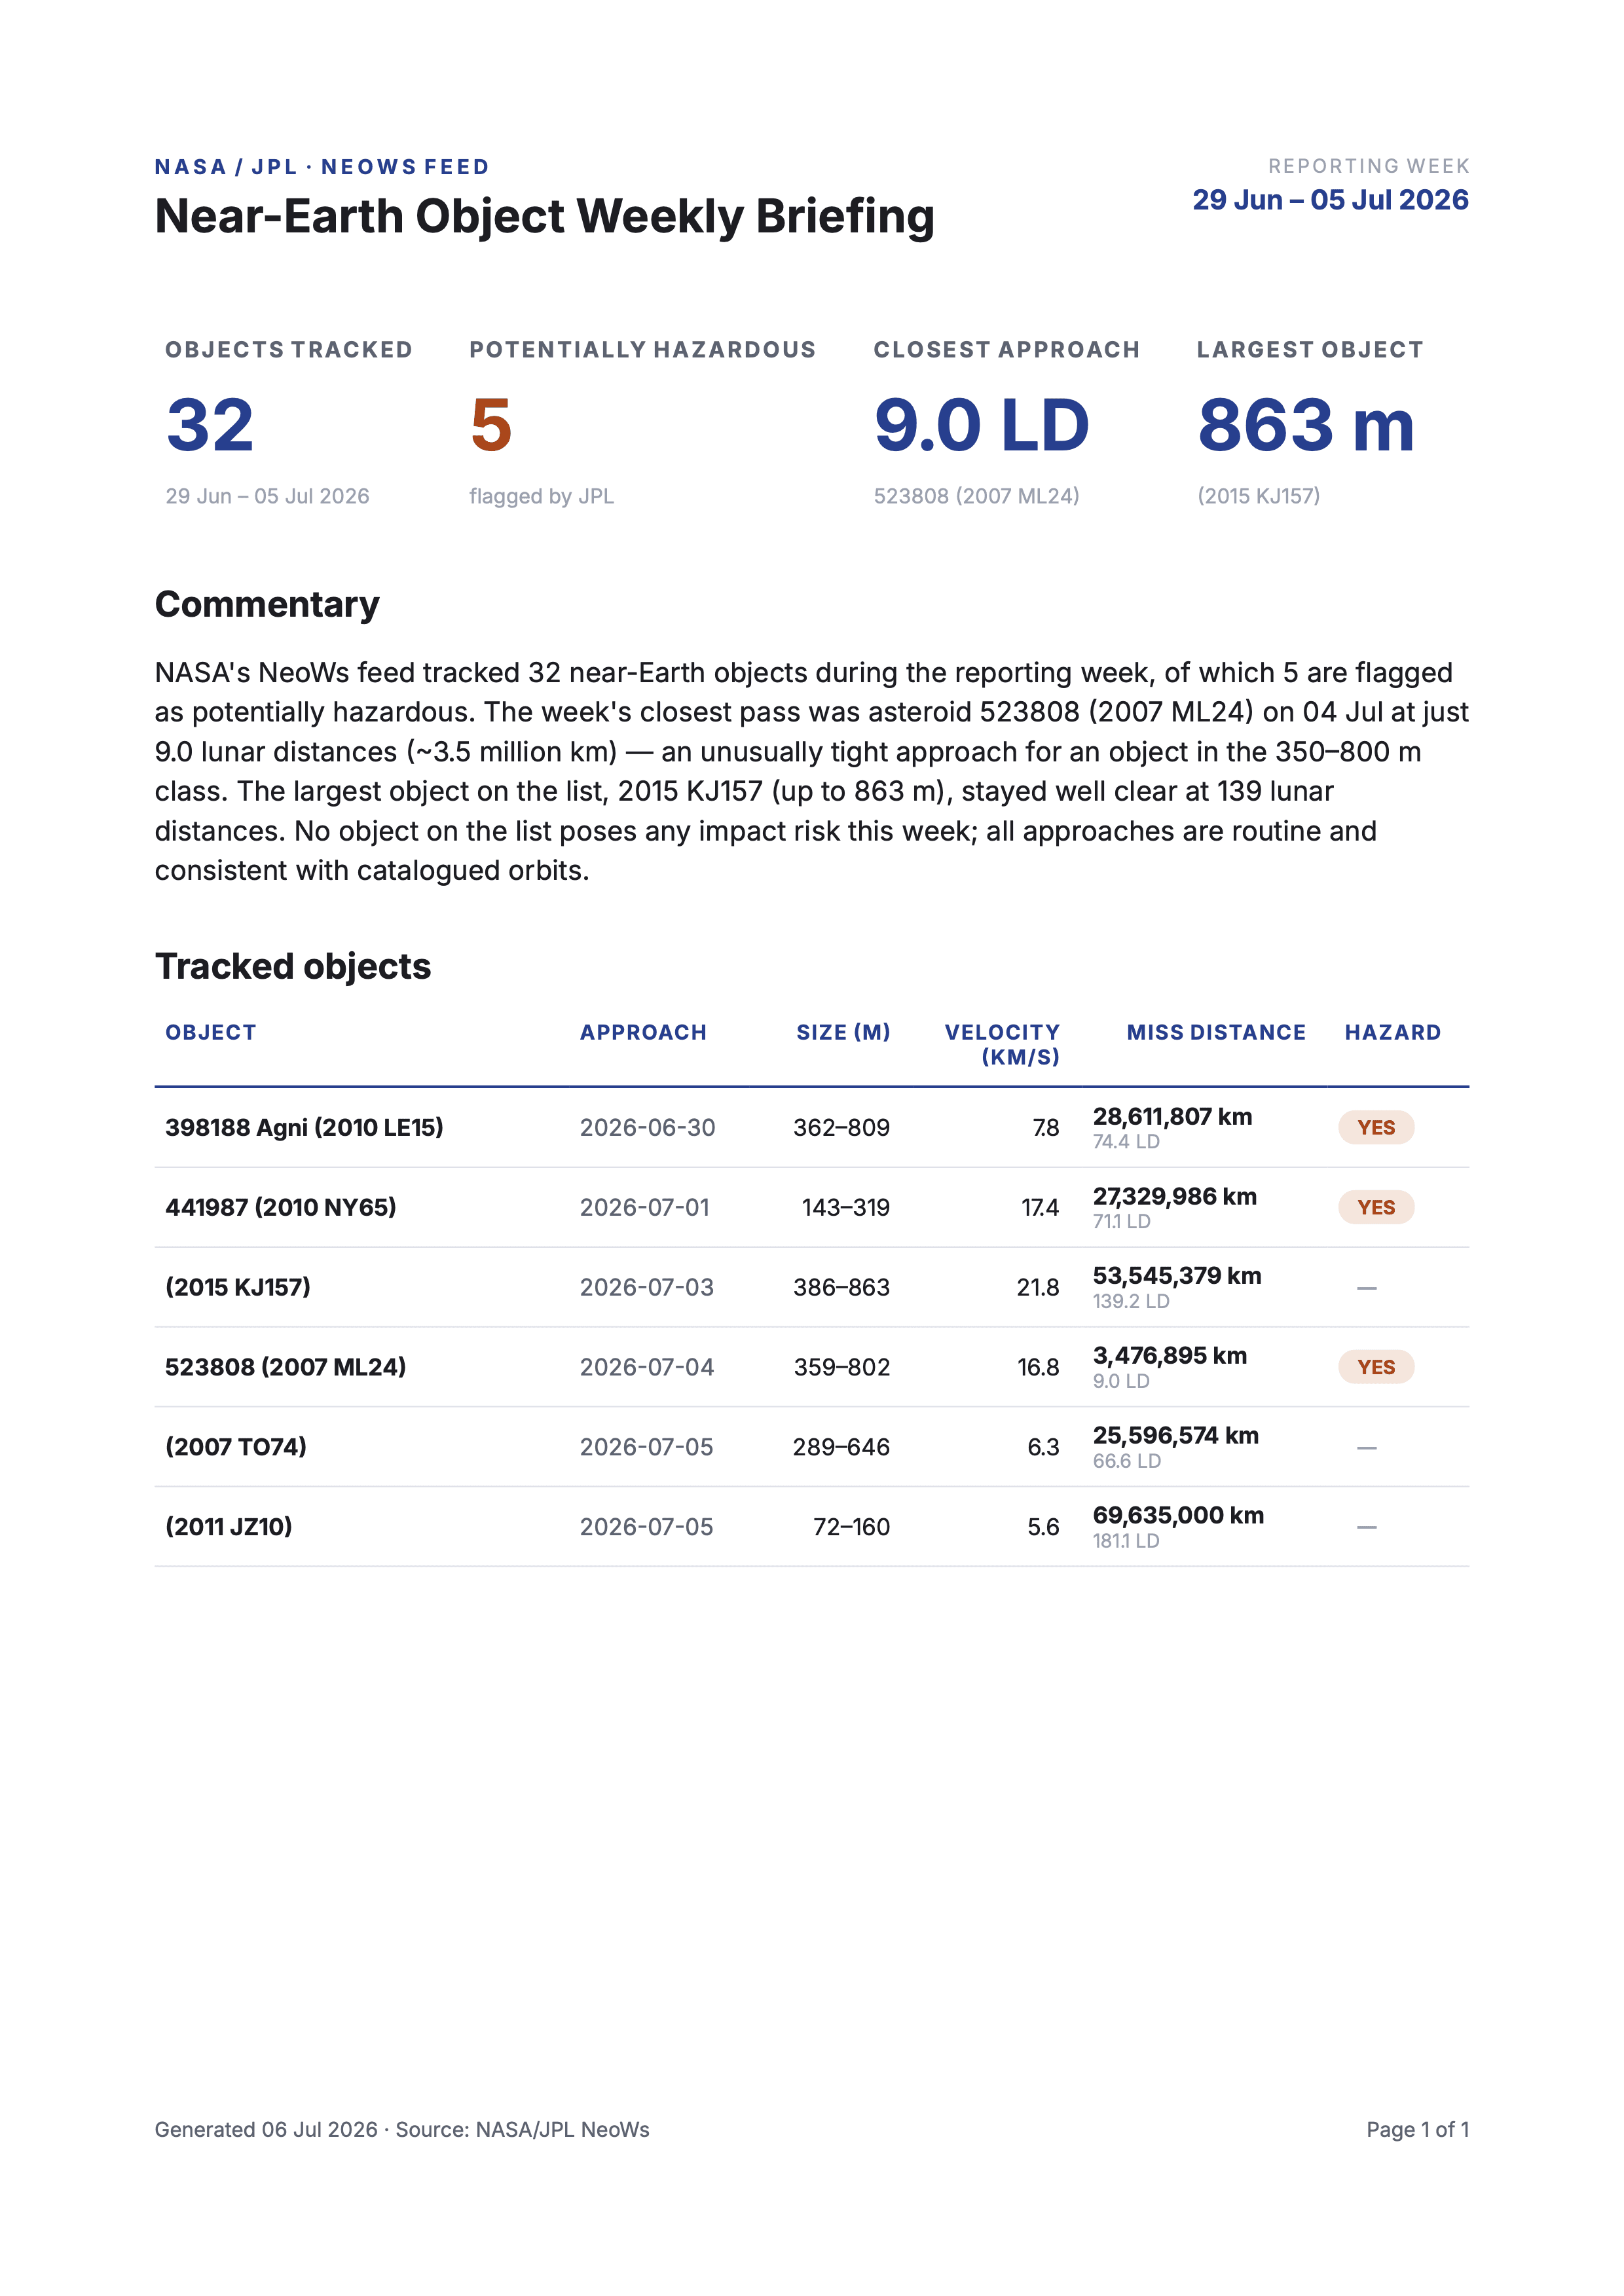
It produced a decent one-page report:
Record the Template ID
You’ll see template URLs containing the template ID in Claude’s output, and also in the web template ID. Make a note of it, as we’ll need it in code later.
Applying Branding
Let’s try rebranding to Papermill’s colours and logo:
Note that I asked for a new template - now we have two available, with and without Papermill’s branding applied.
Adding a Flow
We’ll return to the original template at this point.
I noticed the commentary is currently just a JSON field. That’s fine, but for more complex documents we’re probably going to use Papermill flows - they can contain much richer features like visualisations or references.
Let’s switch to use a Papermill flow for the commentary:
Claude introduces a new flow into the template:
<narrative type="markdown">

	NASA's NeoWs feed tracked **32 near-Earth objects** during the
	reporting week, five of them flagged as *potentially hazardous*.
	Activity was routine: every approach is consistent with catalogued
	orbits, and no object on the list poses any impact risk.

	The week's closest pass was asteroid **523808 (2007 ML24)** on 04 Jul,
	threading past at just **9.0 lunar distances** (~3.5 million km) - an
	unusually tight approach for an object in the 350–800 m class. The
	largest object tracked, **2015 KJ157** (up to 863 m), stayed well
	clear at 139 lunar distances.

</narrative>
It can sometimes be easier to jump into the editor and make minor tweaks like this - just make sure Claude works from the template in Papermill, and not some local cached file it writes to disk.
And so on
You can ask Claude to add a cover page, a photo, change the style or fonts, or make small tweaks.
For example, I added a cover page and chart:
I then asked for a more full-bodied presentation:
Tweaking
Once Claude has gotten you close enough, you might want to finally jump in and manually tweak the template. Open up the template editor and get to work. This step is most useful for tweaking spacing, colours, borders, and other minor tweaks that are too small to justify waiting for Claude to iterate.
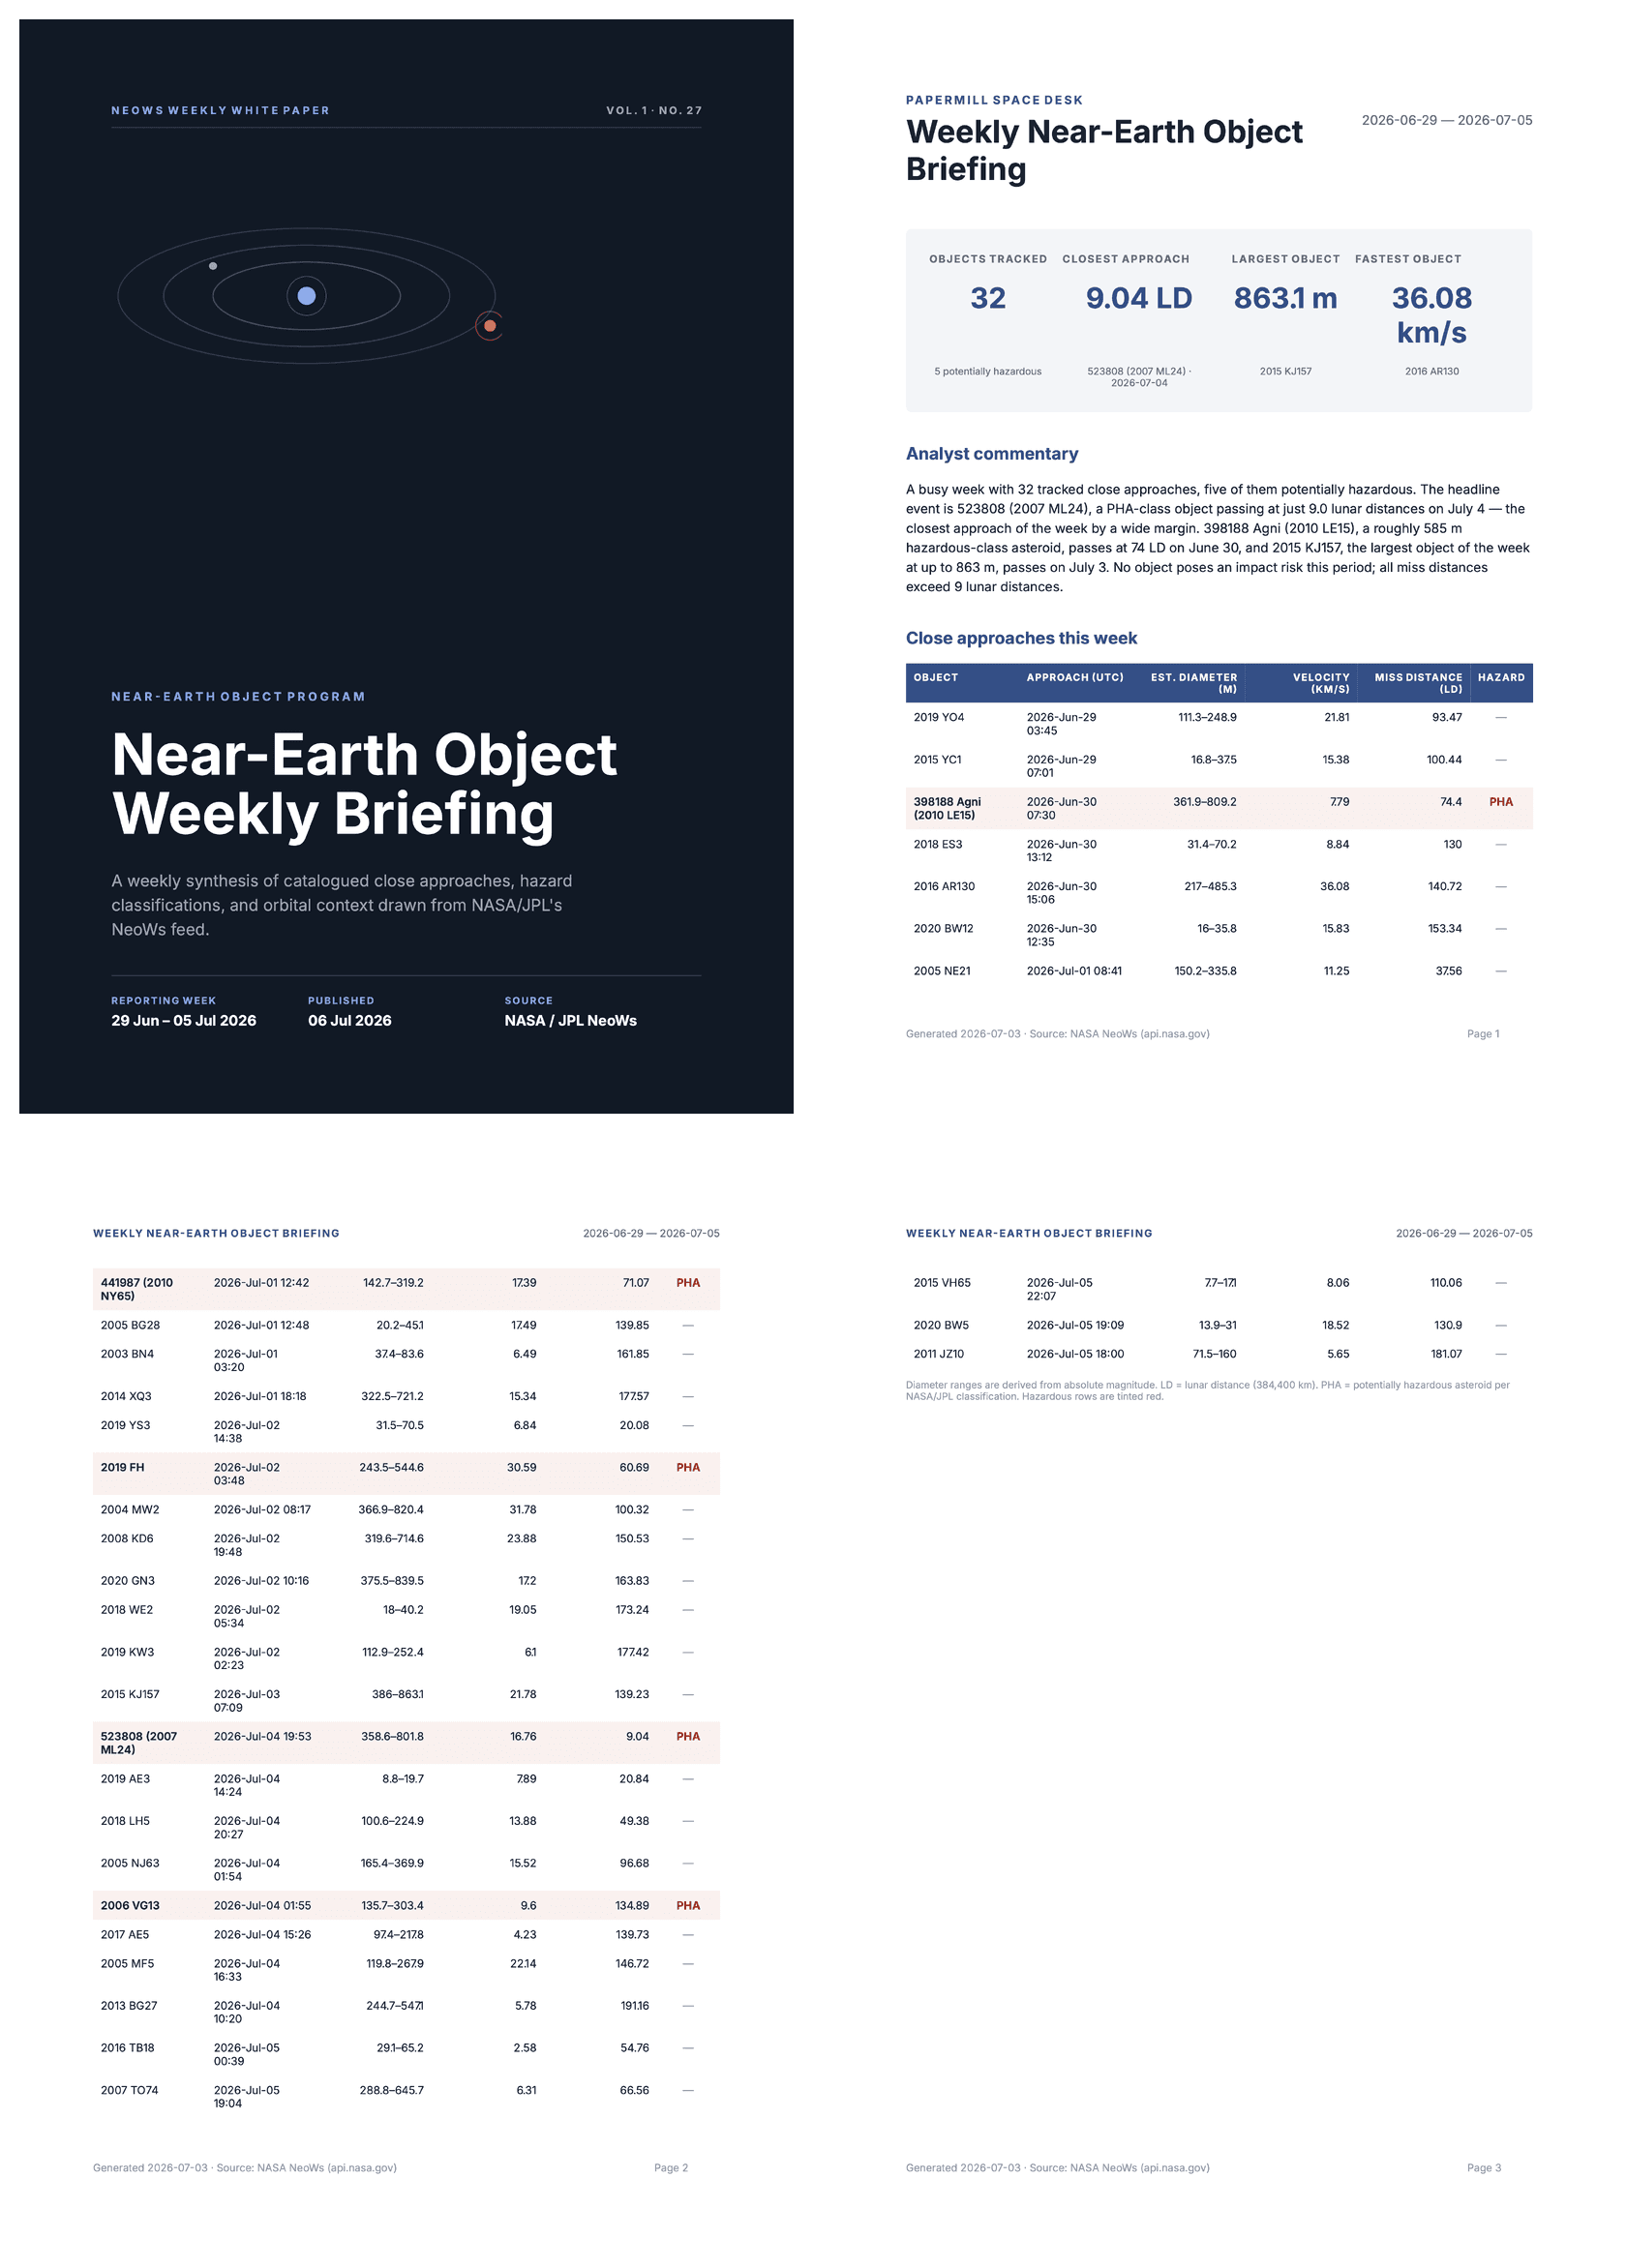
After a little tweaking and minor changes through Claude I had a report ready to go:
From Template to Production
Now we’ve got the template polished, we can immediately start using it from code. We’ll use TypeScript here.
Create an npm project in a new directory:
Tweak your package.json to "type": "module":
{
  "name": "...",
  "type": "module",
  ...
}
Generate an Anthropic API key by using the top-right button at:
https://platform.claude.com/dashboard
Drop this into a source file nearly.ts and set YOUR_TEMPLATE_ID in the code, and PAPERMILL_API_KEY and ANTHROPIC_API_KEY as environment variables.
import Anthropic from "@anthropic-ai/sdk";
import { writeFileSync } from "node:fs";

const START = "2026-06-29";
const END = "2026-07-05";
const TEMPLATE_ID = "YOUR_TEMPLATE_ID";
const day = (iso: string) =>
  new Date(`${iso}T00:00Z`).toLocaleDateString("en-GB", { day: "2-digit", month: "short", timeZone: "UTC" });

// 1. Fetch the week's near-Earth objects.
const feed = await fetch(
  `https://api.nasa.gov/neo/rest/v1/feed?start_date=${START}&end_date=${END}` +
    `&api_key=${process.env.NASA_API_KEY ?? "DEMO_KEY"}`,
).then((r) => r.json());

// 2. Reshape into the report payload.
const rows = Object.values<any>(feed.near_earth_objects).flat().map((o: any) => {
  const ca = o.close_approach_data[0];
  const m = o.estimated_diameter.meters;
  return {
    name: o.name.trim(),
    date: ca.close_approach_date,
    dMin: m.estimated_diameter_min,
    dMax: m.estimated_diameter_max,
    velocity: +ca.relative_velocity.kilometers_per_second,
    missKm: +ca.miss_distance.kilometers,
    missLd: +ca.miss_distance.lunar,
    hazardous: o.is_potentially_hazardous_asteroid,
  };
});

const closest = rows.reduce((a, b) => (b.missKm < a.missKm ? b : a));
const largest = rows.reduce((a, b) => (b.dMax > a.dMax ? b : a));

const data = {
  report: {
    title: "Near-Earth Object Weekly Briefing",
    week_range: `${day(START)} – ${day(END)} 2026`,
    generated: day("2026-07-06"),
    source: "NASA / JPL · NeoWs Feed",
    standfirst: "", // filled by Claude
    pullquote: "", // filled by Claude
  },
  kpis: {
    objects_tracked: String(feed.element_count),
    hazardous_count: String(rows.filter((r) => r.hazardous).length),
    closest: { value: `${closest.missLd.toFixed(1)} LD`, label: closest.name },
    largest: { value: `${Math.round(largest.dMax)} m`, label: largest.name },
  },
  chart: [
    ["Day", "Hazardous", "Other"],
    ...Object.keys(feed.near_earth_objects).sort().map((d) => {
      const r = rows.filter((x) => x.date === d);
      const haz = r.filter((x) => x.hazardous).length;
      return [day(d), haz, r.length - haz];
    }),
  ],
  objects: rows.map((r) => ({
    name: r.name,
    approach_date: r.date,
    size: `${Math.round(r.dMin)}–${Math.round(r.dMax)}`,
    velocity: r.velocity.toFixed(1),
    miss_km: Math.round(r.missKm).toLocaleString("en-US"),
    miss_ld: r.missLd.toFixed(1),
    is_potentially_hazardous: r.hazardous,
  })),
};

// 3. Write the narrative with Claude (Opus 4.8).
const claude = await new Anthropic().messages.create({
  model: "claude-opus-4-8",
  max_tokens: 1024,
  system:
    "You write a weekly near-Earth object briefing for a technical audience. Use only the figures given; never invent data. " +
    "Reply with raw JSON (no code fences): {standfirst, pullquote, narrative} where narrative is two short Markdown paragraphs.",
  messages: [{ role: "user", content: JSON.stringify(data) }],
});
const { standfirst, pullquote, narrative } = JSON.parse((claude.content[0] as any).text);
data.report.standfirst = standfirst;
data.report.pullquote = pullquote;

// 4. Render the PDF via Papermill (narrative in a <flow>, data in a <data> tag).
const press = `<press>
  <flows><narrative type="markdown">
${narrative}
</narrative></flows>
  <data type="json">
${JSON.stringify(data)}
</data>
</press>`;

const pdf = await fetch(`https://api.papermill.io/v2/pdf?template_id=${TEMPLATE_ID}`, {
  method: "POST",
  headers: { "x-api-key": process.env.PAPERMILL_API_KEY, "Content-Type": "application/xml" },
  body: press,
});
writeFileSync("neo-briefing.pdf", Buffer.from(await pdf.arrayBuffer()));
console.log("Wrote neo-briefing.pdf");
Run the code to generate today’s report:
Amazing! Now you can generate weekly reports warning you about near-miss asteroids.
Obviously, this is a toy, but it’s actually a pretty standard workflow: fetching structured data from an API, summarising KPIs, flagging rows that breach a threshold, and adding LLM-written commentary, output in a branded format.
Swap out the key ingredients for your use case:
Hazard flag -> a compliance threshold breach in a planning report
Miss distance -> KPI variance in a weekly ops report
NASA's feed -> your product's usage API, market data, portfolio data
If your team produces client-facing reports from structured data, this is the same pipeline.
Build more using Papermill
You can get started for free by signing up for Papermill here: https://papermill.io/ and following the quickstart in the docs: https://docs.papermill.io/quickstart/
For more tips on how to use Claude, see the Papermill docs.
Producing PDFs programmatically is painful. With the advent of LLMs, generating content is easier than ever - but layout has become more difficult! When the output from a model can vary in size and shape, adapting the document becomes even more important. An agent like Claude can write your report, but turning that into production-grade PDFs means wrestling with HTML-PDF tools or arcane reporting libraries.
I’m going to show you how connecting Claude Code to Papermill’s MCP server makes it easy to design a template that you can then use to reliably generate high-quality production documents. You can achieve similar results with other models.
As an example, we’re going to use Claude+Papermill to generate a PDF briefing of every asteroid that narrowly missed Earth in the last week, taking data from a NASA API.
Use Opus, not Fable
Despite Fable being marketed as a more “visual” model, we’ve found that Opus is just as good - if not better - at producing templates. So please switch /model to the latest version of Opus.
Also, we recommend you set the effort level to "high", that is the default effort level. If you use higher settings, you may find that Claude skips ahead a step sometimes.
Be Prepared to Make Tea
Models like Anthropic’s Fable and Opus, particularly on the higher effort thinking levels, can take their sweet time when generating templates. That’s fine - we can often switch to other tasks whilst it works. But sometimes you’ll want to grab a cup of tea (we’re British, after all) instead of waiting five minutes. We’re always working on speeding up model-Papermill interaction, and expect to see wait times drop as models improve.
Pipeline
We’re going to get the data from the NASA NeoWs API. We’ll use their demo API key as our usage volume will be light.
You can learn more about the API at
https://data.nasa.gov/dataset/asteroids-neows-api
Setup
Install Claude Code if you haven’t already: https://code.claude.com/docs/en/quickstart
Sign up for a free Papermill account: https://papermill.io/
Grab an API key: https://app.papermill.io/settings and set the environment variable PAPERMILL_API_KEY
Add Papermill’s MCP to Claude:
Verify the install:
Decide on a Payload
Let’s ask Claude to shape a clean JSON payload from the raw NASA data:
Claude came back with this pretty tidy-looking JSON:
{
  "report": {
    "title": "Near-Earth Object Weekly Briefing",
    "period": { "start_date": "2026-06-29", "end_date": "2026-07-05" },
    "generated_at": "2026-07-06T00:00:00Z",
    "source": "NASA/JPL NeoWs Feed"
  },

  "kpis": {
    "objects_tracked": 32,
    "potentially_hazardous_count": 5,
    "closest_approach": {
      "name": "523808 (2007 ML24)",
      "date": "2026-07-04",
      "miss_distance_km": 3476895,
      "miss_distance_lunar": 9.04
    },
    "largest_object": {
      "name": "(2015 KJ157)",
      "est_diameter_max_m": 863,
      "is_potentially_hazardous": false
    },
    "fastest_object": {
      "name": "…",
      "velocity_kps": 36.08
    }
  },

  "objects": [
    {
      "name": "523808 (2007 ML24)",
      "approach_date": "2026-07-04",
      "est_diameter_min_m": 120.4,
      "est_diameter_max_m": 269.2,
      "velocity_kps": 12.34,
      "miss_distance_km": 3476895,
      "miss_distance_lunar": 9.04,
      "is_potentially_hazardous": false
    }
  ],

  "commentary": "Free-text analyst summary of the week's activity - trends, notable approaches, and context for the hazardous flags."
}
Initial Template
Let’s ask Claude to generate a first draft of a template:
Once Claude is done, you’ll receive a link to the template in the Papermill editor:
It produced a decent one-page report:
Record the Template ID
You’ll see template URLs containing the template ID in Claude’s output, and also in the web template ID. Make a note of it, as we’ll need it in code later.
Applying Branding
Let’s try rebranding to Papermill’s colours and logo:
Note that I asked for a new template - now we have two available, with and without Papermill’s branding applied.
Adding a Flow
We’ll return to the original template at this point.
I noticed the commentary is currently just a JSON field. That’s fine, but for more complex documents we’re probably going to use Papermill flows - they can contain much richer features like visualisations or references.
Let’s switch to use a Papermill flow for the commentary:
Claude introduces a new flow into the template:
<narrative type="markdown">

	NASA's NeoWs feed tracked **32 near-Earth objects** during the
	reporting week, five of them flagged as *potentially hazardous*.
	Activity was routine: every approach is consistent with catalogued
	orbits, and no object on the list poses any impact risk.

	The week's closest pass was asteroid **523808 (2007 ML24)** on 04 Jul,
	threading past at just **9.0 lunar distances** (~3.5 million km) - an
	unusually tight approach for an object in the 350–800 m class. The
	largest object tracked, **2015 KJ157** (up to 863 m), stayed well
	clear at 139 lunar distances.

</narrative>
It can sometimes be easier to jump into the editor and make minor tweaks like this - just make sure Claude works from the template in Papermill, and not some local cached file it writes to disk.
And so on
You can ask Claude to add a cover page, a photo, change the style or fonts, or make small tweaks.
For example, I added a cover page and chart:
I then asked for a more full-bodied presentation:
Tweaking
Once Claude has gotten you close enough, you might want to finally jump in and manually tweak the template. Open up the template editor and get to work. This step is most useful for tweaking spacing, colours, borders, and other minor tweaks that are too small to justify waiting for Claude to iterate.
After a little tweaking and minor changes through Claude I had a report ready to go:
From Template to Production
Now we’ve got the template polished, we can immediately start using it from code. We’ll use TypeScript here.
Create an npm project in a new directory:
Tweak your package.json to "type": "module":
{
  "name": "...",
  "type": "module",
  ...
}
Generate an Anthropic API key by using the top-right button at:
https://platform.claude.com/dashboard
Drop this into a source file nearly.ts and set YOUR_TEMPLATE_ID in the code, and PAPERMILL_API_KEY and ANTHROPIC_API_KEY as environment variables.
import Anthropic from "@anthropic-ai/sdk";
import { writeFileSync } from "node:fs";

const START = "2026-06-29";
const END = "2026-07-05";
const TEMPLATE_ID = "YOUR_TEMPLATE_ID";
const day = (iso: string) =>
  new Date(`${iso}T00:00Z`).toLocaleDateString("en-GB", { day: "2-digit", month: "short", timeZone: "UTC" });

// 1. Fetch the week's near-Earth objects.
const feed = await fetch(
  `https://api.nasa.gov/neo/rest/v1/feed?start_date=${START}&end_date=${END}` +
    `&api_key=${process.env.NASA_API_KEY ?? "DEMO_KEY"}`,
).then((r) => r.json());

// 2. Reshape into the report payload.
const rows = Object.values<any>(feed.near_earth_objects).flat().map((o: any) => {
  const ca = o.close_approach_data[0];
  const m = o.estimated_diameter.meters;
  return {
    name: o.name.trim(),
    date: ca.close_approach_date,
    dMin: m.estimated_diameter_min,
    dMax: m.estimated_diameter_max,
    velocity: +ca.relative_velocity.kilometers_per_second,
    missKm: +ca.miss_distance.kilometers,
    missLd: +ca.miss_distance.lunar,
    hazardous: o.is_potentially_hazardous_asteroid,
  };
});

const closest = rows.reduce((a, b) => (b.missKm < a.missKm ? b : a));
const largest = rows.reduce((a, b) => (b.dMax > a.dMax ? b : a));

const data = {
  report: {
    title: "Near-Earth Object Weekly Briefing",
    week_range: `${day(START)} – ${day(END)} 2026`,
    generated: day("2026-07-06"),
    source: "NASA / JPL · NeoWs Feed",
    standfirst: "", // filled by Claude
    pullquote: "", // filled by Claude
  },
  kpis: {
    objects_tracked: String(feed.element_count),
    hazardous_count: String(rows.filter((r) => r.hazardous).length),
    closest: { value: `${closest.missLd.toFixed(1)} LD`, label: closest.name },
    largest: { value: `${Math.round(largest.dMax)} m`, label: largest.name },
  },
  chart: [
    ["Day", "Hazardous", "Other"],
    ...Object.keys(feed.near_earth_objects).sort().map((d) => {
      const r = rows.filter((x) => x.date === d);
      const haz = r.filter((x) => x.hazardous).length;
      return [day(d), haz, r.length - haz];
    }),
  ],
  objects: rows.map((r) => ({
    name: r.name,
    approach_date: r.date,
    size: `${Math.round(r.dMin)}–${Math.round(r.dMax)}`,
    velocity: r.velocity.toFixed(1),
    miss_km: Math.round(r.missKm).toLocaleString("en-US"),
    miss_ld: r.missLd.toFixed(1),
    is_potentially_hazardous: r.hazardous,
  })),
};

// 3. Write the narrative with Claude (Opus 4.8).
const claude = await new Anthropic().messages.create({
  model: "claude-opus-4-8",
  max_tokens: 1024,
  system:
    "You write a weekly near-Earth object briefing for a technical audience. Use only the figures given; never invent data. " +
    "Reply with raw JSON (no code fences): {standfirst, pullquote, narrative} where narrative is two short Markdown paragraphs.",
  messages: [{ role: "user", content: JSON.stringify(data) }],
});
const { standfirst, pullquote, narrative } = JSON.parse((claude.content[0] as any).text);
data.report.standfirst = standfirst;
data.report.pullquote = pullquote;

// 4. Render the PDF via Papermill (narrative in a <flow>, data in a <data> tag).
const press = `<press>
  <flows><narrative type="markdown">
${narrative}
</narrative></flows>
  <data type="json">
${JSON.stringify(data)}
</data>
</press>`;

const pdf = await fetch(`https://api.papermill.io/v2/pdf?template_id=${TEMPLATE_ID}`, {
  method: "POST",
  headers: { "x-api-key": process.env.PAPERMILL_API_KEY, "Content-Type": "application/xml" },
  body: press,
});
writeFileSync("neo-briefing.pdf", Buffer.from(await pdf.arrayBuffer()));
console.log("Wrote neo-briefing.pdf");
Run the code to generate today’s report:
Amazing! Now you can generate weekly reports warning you about near-miss asteroids.
Obviously, this is a toy, but it’s actually a pretty standard workflow: fetching structured data from an API, summarising KPIs, flagging rows that breach a threshold, and adding LLM-written commentary, output in a branded format.
Swap out the key ingredients for your use case:
Hazard flag -> a compliance threshold breach in a planning report
Miss distance -> KPI variance in a weekly ops report
NASA's feed -> your product's usage API, market data, portfolio data
If your team produces client-facing reports from structured data, this is the same pipeline.
Build more using Papermill
You can get started for free by signing up for Papermill here: https://papermill.io/ and following the quickstart in the docs: https://docs.papermill.io/quickstart/
For more tips on how to use Claude, see the Papermill docs.
Producing PDFs programmatically is painful. With the advent of LLMs, generating content is easier than ever - but layout has become more difficult! When the output from a model can vary in size and shape, adapting the document becomes even more important. An agent like Claude can write your report, but turning that into production-grade PDFs means wrestling with HTML-PDF tools or arcane reporting libraries.
I’m going to show you how connecting Claude Code to Papermill’s MCP server makes it easy to design a template that you can then use to reliably generate high-quality production documents. You can achieve similar results with other models.
As an example, we’re going to use Claude+Papermill to generate a PDF briefing of every asteroid that narrowly missed Earth in the last week, taking data from a NASA API.
Use Opus, not Fable
Despite Fable being marketed as a more “visual” model, we’ve found that Opus is just as good - if not better - at producing templates. So please switch /model to the latest version of Opus.
Also, we recommend you set the effort level to "high", that is the default effort level. If you use higher settings, you may find that Claude skips ahead a step sometimes.
Be Prepared to Make Tea
Models like Anthropic’s Fable and Opus, particularly on the higher effort thinking levels, can take their sweet time when generating templates. That’s fine - we can often switch to other tasks whilst it works. But sometimes you’ll want to grab a cup of tea (we’re British, after all) instead of waiting five minutes. We’re always working on speeding up model-Papermill interaction, and expect to see wait times drop as models improve.
Pipeline
We’re going to get the data from the NASA NeoWs API. We’ll use their demo API key as our usage volume will be light.
You can learn more about the API at
https://data.nasa.gov/dataset/asteroids-neows-api
Setup
Install Claude Code if you haven’t already: https://code.claude.com/docs/en/quickstart
Sign up for a free Papermill account: https://papermill.io/
Grab an API key: https://app.papermill.io/settings and set the environment variable PAPERMILL_API_KEY
Add Papermill’s MCP to Claude:
Verify the install:
Decide on a Payload
Let’s ask Claude to shape a clean JSON payload from the raw NASA data:
Claude came back with this pretty tidy-looking JSON:
{
  "report": {
    "title": "Near-Earth Object Weekly Briefing",
    "period": { "start_date": "2026-06-29", "end_date": "2026-07-05" },
    "generated_at": "2026-07-06T00:00:00Z",
    "source": "NASA/JPL NeoWs Feed"
  },

  "kpis": {
    "objects_tracked": 32,
    "potentially_hazardous_count": 5,
    "closest_approach": {
      "name": "523808 (2007 ML24)",
      "date": "2026-07-04",
      "miss_distance_km": 3476895,
      "miss_distance_lunar": 9.04
    },
    "largest_object": {
      "name": "(2015 KJ157)",
      "est_diameter_max_m": 863,
      "is_potentially_hazardous": false
    },
    "fastest_object": {
      "name": "…",
      "velocity_kps": 36.08
    }
  },

  "objects": [
    {
      "name": "523808 (2007 ML24)",
      "approach_date": "2026-07-04",
      "est_diameter_min_m": 120.4,
      "est_diameter_max_m": 269.2,
      "velocity_kps": 12.34,
      "miss_distance_km": 3476895,
      "miss_distance_lunar": 9.04,
      "is_potentially_hazardous": false
    }
  ],

  "commentary": "Free-text analyst summary of the week's activity - trends, notable approaches, and context for the hazardous flags."
}
Initial Template
Let’s ask Claude to generate a first draft of a template:
Once Claude is done, you’ll receive a link to the template in the Papermill editor:
It produced a decent one-page report:
Record the Template ID
You’ll see template URLs containing the template ID in Claude’s output, and also in the web template ID. Make a note of it, as we’ll need it in code later.
Applying Branding
Let’s try rebranding to Papermill’s colours and logo:
Note that I asked for a new template - now we have two available, with and without Papermill’s branding applied.
Adding a Flow
We’ll return to the original template at this point.
I noticed the commentary is currently just a JSON field. That’s fine, but for more complex documents we’re probably going to use Papermill flows - they can contain much richer features like visualisations or references.
Let’s switch to use a Papermill flow for the commentary:
Claude introduces a new flow into the template:
<narrative type="markdown">

	NASA's NeoWs feed tracked **32 near-Earth objects** during the
	reporting week, five of them flagged as *potentially hazardous*.
	Activity was routine: every approach is consistent with catalogued
	orbits, and no object on the list poses any impact risk.

	The week's closest pass was asteroid **523808 (2007 ML24)** on 04 Jul,
	threading past at just **9.0 lunar distances** (~3.5 million km) - an
	unusually tight approach for an object in the 350–800 m class. The
	largest object tracked, **2015 KJ157** (up to 863 m), stayed well
	clear at 139 lunar distances.

</narrative>
It can sometimes be easier to jump into the editor and make minor tweaks like this - just make sure Claude works from the template in Papermill, and not some local cached file it writes to disk.
And so on
You can ask Claude to add a cover page, a photo, change the style or fonts, or make small tweaks.
For example, I added a cover page and chart:
I then asked for a more full-bodied presentation:
Tweaking
Once Claude has gotten you close enough, you might want to finally jump in and manually tweak the template. Open up the template editor and get to work. This step is most useful for tweaking spacing, colours, borders, and other minor tweaks that are too small to justify waiting for Claude to iterate.
After a little tweaking and minor changes through Claude I had a report ready to go:
From Template to Production
Now we’ve got the template polished, we can immediately start using it from code. We’ll use TypeScript here.
Create an npm project in a new directory:
Tweak your package.json to "type": "module":
{
  "name": "...",
  "type": "module",
  ...
}
Generate an Anthropic API key by using the top-right button at:
https://platform.claude.com/dashboard
Drop this into a source file nearly.ts and set YOUR_TEMPLATE_ID in the code, and PAPERMILL_API_KEY and ANTHROPIC_API_KEY as environment variables.
import Anthropic from "@anthropic-ai/sdk";
import { writeFileSync } from "node:fs";

const START = "2026-06-29";
const END = "2026-07-05";
const TEMPLATE_ID = "YOUR_TEMPLATE_ID";
const day = (iso: string) =>
  new Date(`${iso}T00:00Z`).toLocaleDateString("en-GB", { day: "2-digit", month: "short", timeZone: "UTC" });

// 1. Fetch the week's near-Earth objects.
const feed = await fetch(
  `https://api.nasa.gov/neo/rest/v1/feed?start_date=${START}&end_date=${END}` +
    `&api_key=${process.env.NASA_API_KEY ?? "DEMO_KEY"}`,
).then((r) => r.json());

// 2. Reshape into the report payload.
const rows = Object.values<any>(feed.near_earth_objects).flat().map((o: any) => {
  const ca = o.close_approach_data[0];
  const m = o.estimated_diameter.meters;
  return {
    name: o.name.trim(),
    date: ca.close_approach_date,
    dMin: m.estimated_diameter_min,
    dMax: m.estimated_diameter_max,
    velocity: +ca.relative_velocity.kilometers_per_second,
    missKm: +ca.miss_distance.kilometers,
    missLd: +ca.miss_distance.lunar,
    hazardous: o.is_potentially_hazardous_asteroid,
  };
});

const closest = rows.reduce((a, b) => (b.missKm < a.missKm ? b : a));
const largest = rows.reduce((a, b) => (b.dMax > a.dMax ? b : a));

const data = {
  report: {
    title: "Near-Earth Object Weekly Briefing",
    week_range: `${day(START)} – ${day(END)} 2026`,
    generated: day("2026-07-06"),
    source: "NASA / JPL · NeoWs Feed",
    standfirst: "", // filled by Claude
    pullquote: "", // filled by Claude
  },
  kpis: {
    objects_tracked: String(feed.element_count),
    hazardous_count: String(rows.filter((r) => r.hazardous).length),
    closest: { value: `${closest.missLd.toFixed(1)} LD`, label: closest.name },
    largest: { value: `${Math.round(largest.dMax)} m`, label: largest.name },
  },
  chart: [
    ["Day", "Hazardous", "Other"],
    ...Object.keys(feed.near_earth_objects).sort().map((d) => {
      const r = rows.filter((x) => x.date === d);
      const haz = r.filter((x) => x.hazardous).length;
      return [day(d), haz, r.length - haz];
    }),
  ],
  objects: rows.map((r) => ({
    name: r.name,
    approach_date: r.date,
    size: `${Math.round(r.dMin)}–${Math.round(r.dMax)}`,
    velocity: r.velocity.toFixed(1),
    miss_km: Math.round(r.missKm).toLocaleString("en-US"),
    miss_ld: r.missLd.toFixed(1),
    is_potentially_hazardous: r.hazardous,
  })),
};

// 3. Write the narrative with Claude (Opus 4.8).
const claude = await new Anthropic().messages.create({
  model: "claude-opus-4-8",
  max_tokens: 1024,
  system:
    "You write a weekly near-Earth object briefing for a technical audience. Use only the figures given; never invent data. " +
    "Reply with raw JSON (no code fences): {standfirst, pullquote, narrative} where narrative is two short Markdown paragraphs.",
  messages: [{ role: "user", content: JSON.stringify(data) }],
});
const { standfirst, pullquote, narrative } = JSON.parse((claude.content[0] as any).text);
data.report.standfirst = standfirst;
data.report.pullquote = pullquote;

// 4. Render the PDF via Papermill (narrative in a <flow>, data in a <data> tag).
const press = `<press>
  <flows><narrative type="markdown">
${narrative}
</narrative></flows>
  <data type="json">
${JSON.stringify(data)}
</data>
</press>`;

const pdf = await fetch(`https://api.papermill.io/v2/pdf?template_id=${TEMPLATE_ID}`, {
  method: "POST",
  headers: { "x-api-key": process.env.PAPERMILL_API_KEY, "Content-Type": "application/xml" },
  body: press,
});
writeFileSync("neo-briefing.pdf", Buffer.from(await pdf.arrayBuffer()));
console.log("Wrote neo-briefing.pdf");
Run the code to generate today’s report:
Amazing! Now you can generate weekly reports warning you about near-miss asteroids.
Obviously, this is a toy, but it’s actually a pretty standard workflow: fetching structured data from an API, summarising KPIs, flagging rows that breach a threshold, and adding LLM-written commentary, output in a branded format.
Swap out the key ingredients for your use case:
Hazard flag -> a compliance threshold breach in a planning report
Miss distance -> KPI variance in a weekly ops report
NASA's feed -> your product's usage API, market data, portfolio data
If your team produces client-facing reports from structured data, this is the same pipeline.
Build more using Papermill
You can get started for free by signing up for Papermill here: https://papermill.io/ and following the quickstart in the docs: https://docs.papermill.io/quickstart/
For more tips on how to use Claude, see the Papermill docs.
Like this article? Share it.


